.png)


While yes, it is true that the federal funds effective rate (the “interest rate set by the Fed”), US Treasury bond interest rates and mortgage interest rates are all different things and calculated in different fashions with different factors, at the end of the day, mortgage rates in the United States, including mortgage rates for DSCR Loans, are primarily driven by the Fed (Federal Reserve) interest rates.
While it’s too simplified to say it’s the same, it’s also too simplified when smug commentators chime in “ackshually,” the Fed doesn’t set mortgage rates” which isn’t really accurate either. The facts are that ever since the 2008 financial crisis spurred unprecedented responses by the Federal Reserve to enact a “zero interest rate policy” or “ZIRP” and the radical implementation of “quantitative easing” i.e. the Federal Reserve openly buying US Treasury Bonds (and later, even bought MBS too!) to support the bond market, Federal Reserve policy is the true Elephant in the Room when it comes to the US financial system and bond market (including interest rates).
Treasury Yields thus are now overwhelmingly determined downstream from Federal Reserve monetary policy (including both federal funds rate setting and quantitative easing or tightening), so mortgage rates follow suit. The “spread” between the federal funds rate and the 10-year and 5-year Treasury yields has been tiny (i.e. barely a difference) since 2020, when the Federal Reserve doubled and tripled down on ZIRP and quantitative easing intervention in response to COVID and government-imposed “lockdown” measures that stifled and distorted the economy, and spurred further radical Fed intervention.
What is important for real estate investors to know is that since 2020, and going strong for six years and counting, is that mortgage rates, including DSCR loan rates (or the macro portion – base stacks, before LLPAs and other micro adjustments specific to the borrower and property) are primarily dependent on the corresponding federal funds rate. However, one final caveat is needed. Mortgage rates primarily change based on anticipated future federal funds rate, i.e. how the Federal Reserve is likely to act (i.e. raise, cut or keep the same) in the near-future. The Federal Reserve Open Market Committee (FOMC), or the group that sets the federal funds rates, generally meets eight times per year (with the ability to have unscheduled, “emergency” meetings as necessary), and Treasury yields and market mortgage rates generally move up and down based on financial traders’ anticipation of Fed action at the next FOMC meeting or two.
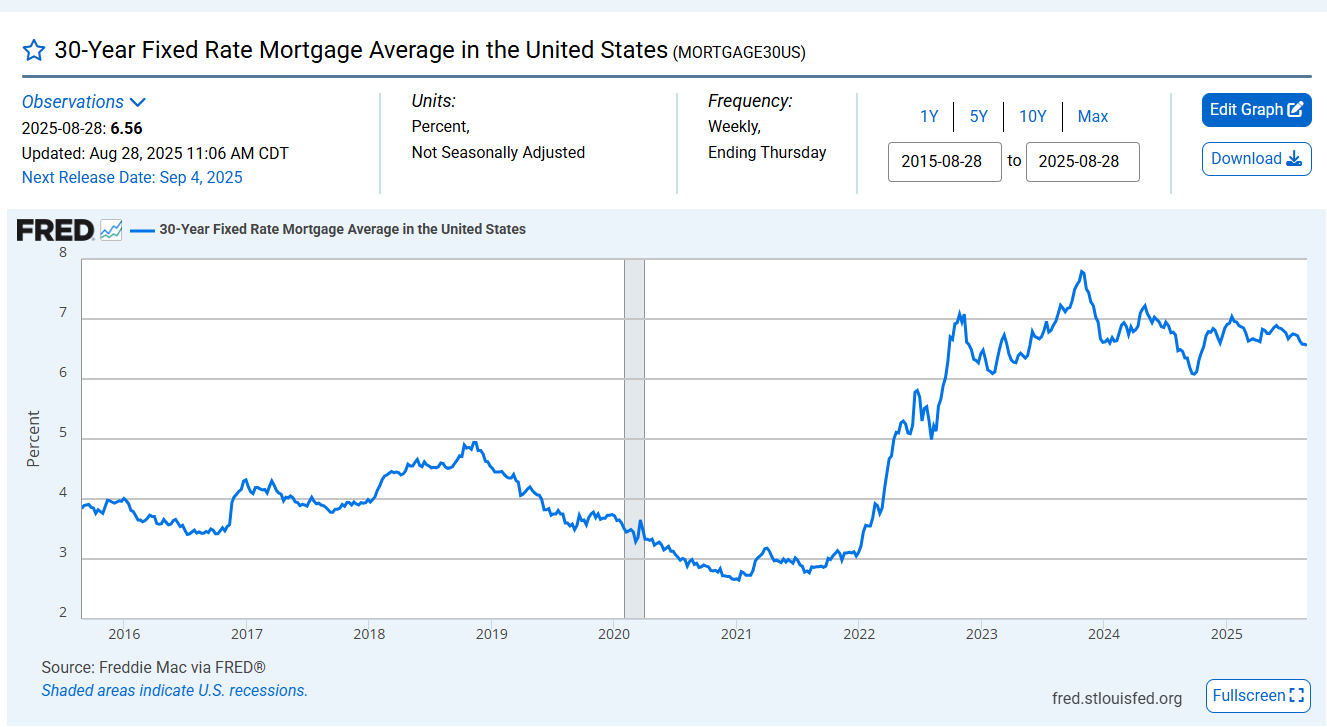
Here is a graph of the average “30-Year Fixed Rate Mortgage Average” in the US (these are for conventional loans, but DSCR Loan base rates are typically similar, but about 0.75% to 1.00% higher in spread:
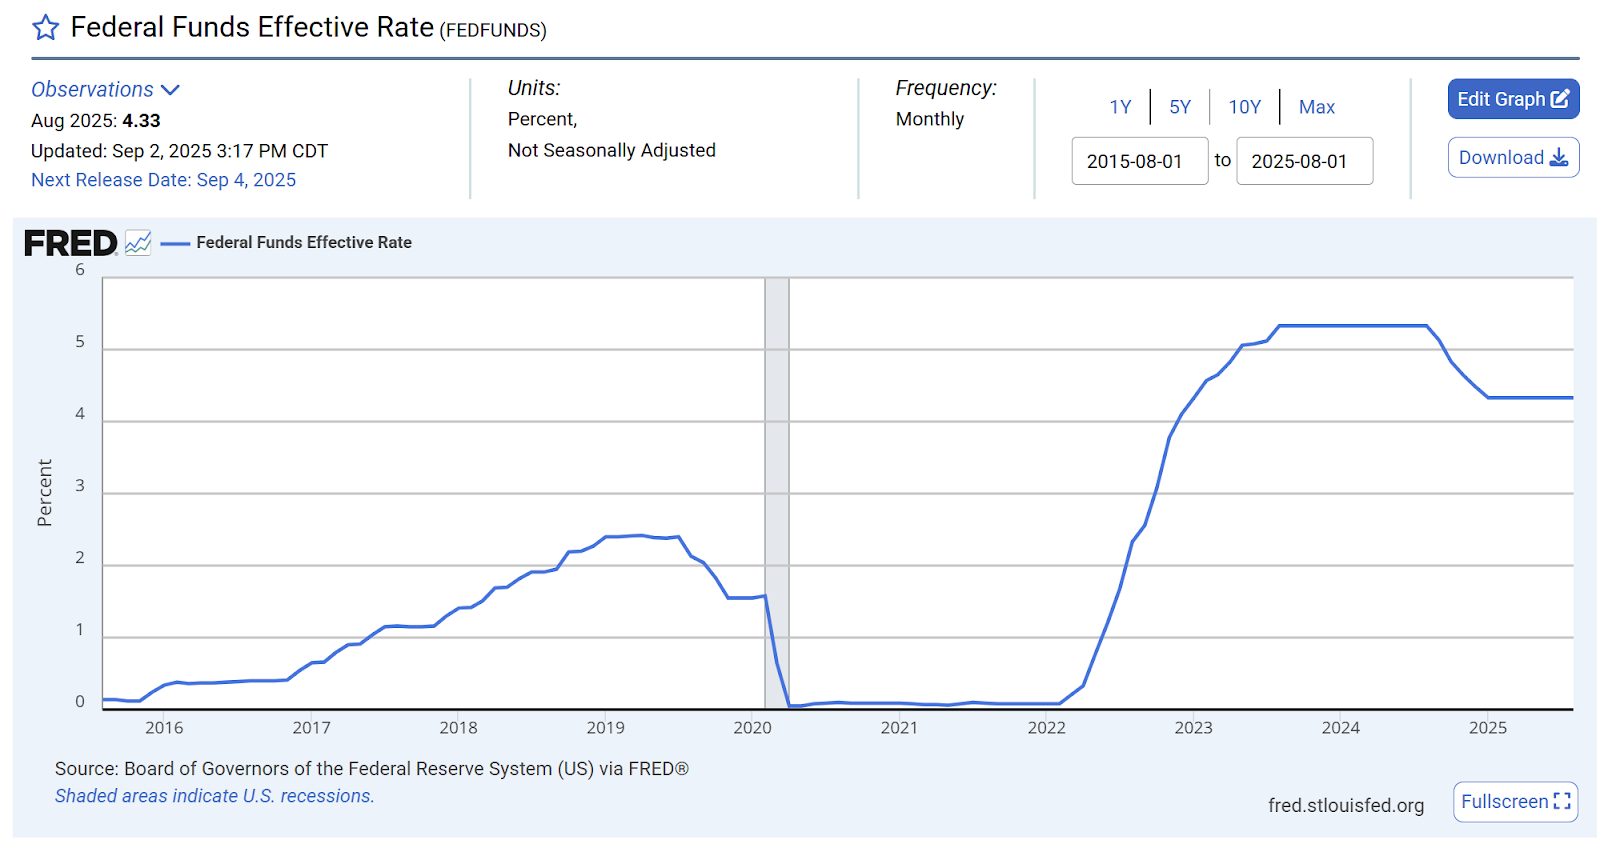
Now take a look at the “Federal Funds Effective Rate” over the same time frame:
Thus, for better or worse, the US financial system is now increasingly driven by the determinations of these Federal Reserve officials, so much that everything from stock market moves towards the interest rate you’ll get on your home or rental property are increasingly driven by the decisions of this small, unelected group of economists, and less and less due to economic “fundamentals” in a purportedly “free market” system.
The Federal Reserve repeatedly claims and indicates that their rate decisions are “data-driven,” with particular attention to economic data reports that shine a light on the two most important metrics of their “dual mandate:” price stability (i.e. low inflation) and employment (i.e. low unemployment). In sum, the market (macro) portion of mortgage rates (including DSCR loan rates) primarily moves up and down based on overall economic reports related to unemployment or inflation; and the effect that data has on expectations of changes in interest rate policy at the Federal Reserve’s next scheduled meeting or two.

This nuance is also why Treasury yields and mortgage rates tend to barely change on the actual day the FOMC announces rate changes, even when the Fed makes significant moves like 75 basis points at once. The Federal Reserve generally telegraphs its upcoming moves to market watchers in the immediate time period leading up to FOMC meetings, likely with intentions to reduce volatility, so by the time that the actual change occurs, the change had already been “priced in” or fully expected by the market.
For example, when the Fed raised rates by a whopping 75 basis points on November 2, 2022, the change in the 10-Year Treasury yield that day was only a tiny 3 basis points, closing at 4.10% versus a 4.07% yield the day before. This is because the market was fully expecting and “pricing in” this rate increase over the preceding couple of months so by the time it actually happened, the effect had mostly already played out in the market. Indeed, the 10-year Treasury yield was just 3.51% at the date of the prior FOMC meeting on September 21, 2022 – so in the interceding 42 days before the rate increase, the 10-Year Treasury yield increased 59 basis points. This example illustrates how the majority of change in yields (and mortgage rates) occurs in the run-up to the decision date rather than the date itself, with most of the move occurring in the months between meetings.
As this example illustrates, the rate increases or decreases reflected in Treasury yields and mortgage rates driven by the federal funds rate are typically front-run or occur in the month or two prior to the actual interest rate change by the Federal Reserve. Treasury Yields and DSCR loan interest rates are not 100% driven by federal reserve rates and don’t move one-to-one, however, it is the primary factor, specifically the anticipated upcoming expected federal funds rate rather than the exact rate on any given day.
The CME Group provides a live website showing what rate moves are “priced in” for every day and for each upcoming meeting. It will show the current days’ expected odds (i.e. what’s “priced in”) for the expected fed funds rate at the next meeting or two as well as how the odds or what’s priced in has changed day-over-day, week-over-week, etc. Treasury yields and mortgage rates generally move when those odds move, i.e. if an economic report is released that makes onlookers think the data will make it more likely that the Federal Reserve will raise rates at the upcoming meeting, then the “odds” on the CME Group tracker might jump from 60% chance to 80% chance of the federal funds rate being 25 basis points higher at the next meeting, with Treasury yields and market mortgage rates likely moving in concert.
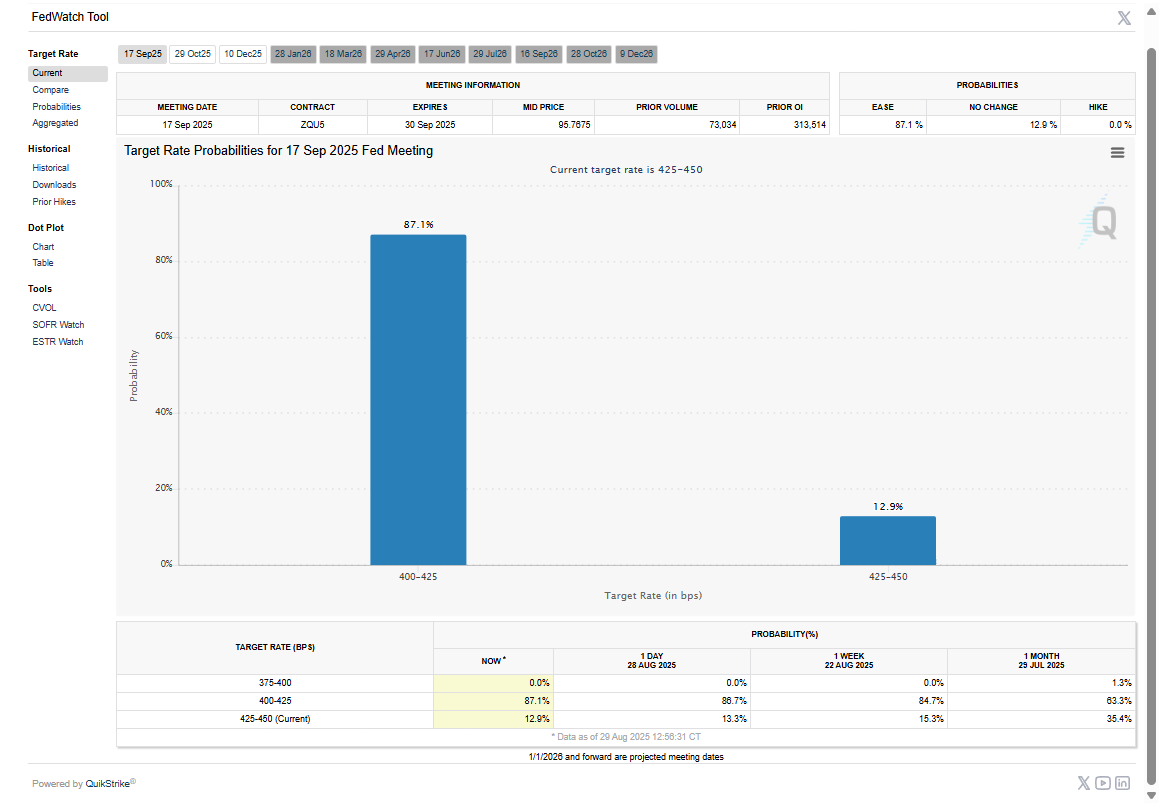
This example view of a Fedwatch Tool showing that the market expects an 87.1% chance that the Fed Interest Rate will be 400-425 announced at the September 17, 2025 meeting, which would represent a 25 basis point cut from the current federal funds rate (and a corresponding 12.9% chance the Fed leaves rates unchanged). This view was taken on August 29, 2025 – and shows how the 87.1% chance is ever so slightly higher than the preceding days’ 86.7% chance and 84.7% from a week prior. Unsurprisingly, the 10-year Treasury yield for the day was up a single basis point (0.01%), reflecting the lack of rate change expectations during the day. The Fed did indeed cut rates by 25 basis points 20 days later, fulfilling the expectation.
All of this to illustrate the basic takeaway: DSCR Loan rates, or the base stack portion based on the market rather than the specific borrower and property, are driven by near-term expectations of rate changes from the Federal Reserve. Similar to how DSCR Loan qualification is primarily driven by the property, but also has other factors like borrower credit and liquidity, DSCR Loan rates are primarily driven by the Federal Reserve Funds rate, especially since 2020 when the Federal Reserve enacted unprecedented intervention in the markets as part of the COVID response. Thus, watching the near-term federal funds rate expectations is the key to a well-informed real estate investor looking to track DSCR Loan market rates and planning when to lock rates or to acquire and/or refinance.
© 2026 Harpoon Capital, LLC. All Rights Reserved. WARNING: Unauthorized distribution, copying, or sharing of this guide is a violation of U.S. Federal Law and is punishable by civil penalties of up to $150,000 per violation. We aggressively enforce our intellectual property rights.